ProPEAT plots had the darkest green color and exhibited the best growth.
Intensively managed turfgrasses on golf courses and athletic fields require close attention to nutritional nitrogen (N) management in order to maintain plant health. Historically, frequent applications of soluable N sources have been used to sustain the desired growth characteristics. These applications must be repeated frequently and increase the risk of N leaving the system through runoff or leaching events to become an envioronmental concern. Improvements in fertilizer manufacturing technology over the past couple of decades has developed N sources which release N over extended periods. These slow-release N sources are an imrpovement over soluble N sources due to their ability to sustain turfgrasses without growth flushes while at the same time minimizing the environmental impact. This study was initiated to provide a preliminary evaluation of ProPEAT fertilizer for use as a nitrogen source for turfgrass systems.
Principal Investigator:
Jason Kruse
Environmental Horticulture Department
P.O. Box 110670
University of Florida
Gainesville, FL 32611
Materials and Methods
A study was initiated to evaluate the ProPEAT fertilizer product for performance as slow-release nitrogen fertilizer when compared against serveral industry standards. The treatments listed below were applied to 3' x 5' plots located at the University of Florida Landscape Teaching Lab located in Gainesville, FL beginning March 14, 2014. All treatments were applied at a nitroget rate of 2 lbs/1000f2 in a single application and monitored weekly for a period of six weeks. Plots were located on a stand of 'All-Sport' perennial ryegrass (Lolium perenne). Each treatment was replicated four times in a randomized comete block experimental design.
Note: M = 1000 ft2 when fertilizer rates are discussed below.
Treatments
- Standard Urea (46-0-0)
- Sulfur-Coated Urea (37-0-0)
- Polyon (45-0-0)
- PrePEAT (20-5-10)
- Untreated Control
Data Collection
Turf visual ratings (color and quality) measurements were taken throughout the duration of the study using a 1-9 scales where 1 = worst; 9 = best; 6 = minimally acceptable). Digital image analysis was performed on digital pictures taken of each plot on weekly throughout the duration of the study. Images were analyzed using SigmaScan Software through the use of a macro titled "Turf Analysis 1.2" which allows for batch analysis of digital images to calculate percent cover. In addition, the Dark Green Color Index (DGCI) was calculated for each plot based on the data collected through the image analysis process. All data were analyzed in SAS and means were separated by Duncan's Least Square Means procedure (P=0-05). Results
Visual Ratings
Visual color and quality ratings were collected weekly.
- ProPEAT produced a darker green visual color for more than four weeks of the study. By then end of the study (six weeks), visual color was similar to other fertilizer treatments.
- Plots receiving the ProPEAT fertilizer treatment responded very quickly to the application with improved color and quality, outperforming all other treatments. The visual quality of the plots receiving the ProPEAT treatment exhibited an improved quality over all other treatments throughout the duration of the study.
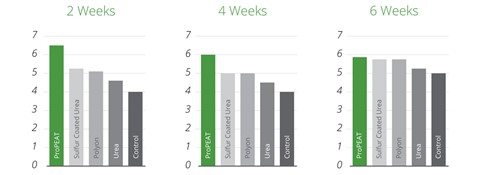
VISUAL COLOR
Figure 1. Visual color ratings of plots at 2, 4, and 6 weeks after initiation of the project. Columns sharing the same letter(s) are not significantly different according to Duncan's Least Square Means separation (p=0.05).
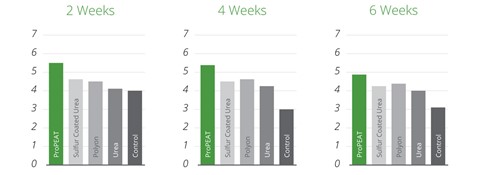
VISUAL QUALITY
Figure 2. Visual quality ratings of plots at 2, 4, and 6 weeks after initiation of the project. Columns sharing the same letter(s) are not significantly different according to Duncan's Least Square Means separation (p=0.05).
Digital Image Analysis
Digital images were collected weekly and analyzed to calculate percent green cover (density) and Dark Green Color Index (DGCI).
- The ProPEAT treatment produced the highest density throughout the study.
- Beginning at week 2 the ProPEAT treatment produced a higher density than all other treatments.
- At weeks 4 and 6, the ProPEAT and Polyon treatments show no differences in density.
- For the DCGI, the ProPEAT treatment resulted in the darkest color throughout the study.
- At weeks 2 and 4, the ProPEAT treatments was significantly darker in color than all other treatments.
- At week 6, there were no differences in green color between the ProPEAT, sulfur coated urea, Polyon, and urea; and all were darker in color than the untreated control.
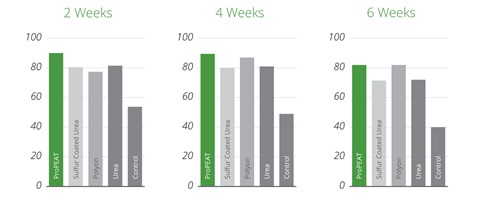
DIA - GREEN COVER
Figure 3. Digital Image Analysis (DIA) of green density of plots at 2, 4, and 6 weeks after initiation of the project. Columns sharing the same letter(s) are not significantly different according to Duncan's Least Square Means separation (p=0.05).
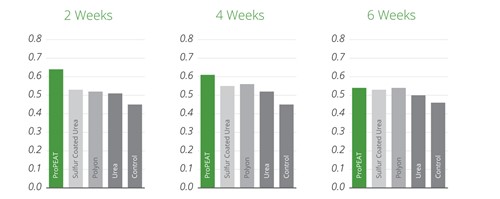
DIA - DCGI
Figure 4. Digital Image Analysis (DIA) Dark Green Color Index (DGCI) of plots at 2, 4, and 6 weeks after the initiation of the project. Columns sharing the same letter(s) are not significantly different according to Duncan's Least Square Means separation (p=0.05).
Summary/Conclusions
The ProPEAT fertilizer material that was investigated in this trial performed well when compared to Polyon, sulfur-coated urea, and soluble urea over the six-week trial period on perennial ryegrass. Plts receiving the ProPEAT fertilizer treatment greened up and filled in very quickly. Throughout the duration of the study the ProPEAT plots had the darkest green color and exhibited the best growth based on personal observations. Future work should investigate the use of this fertilizer product over a longer period of time and on both greens-height and fairway-height bermudagrass systems.
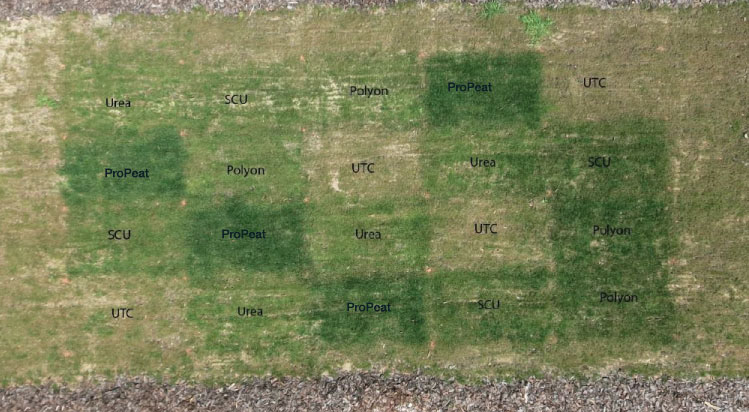
Figure 5. Aerial photograph of perennial ryegrass study area at four weeks after initiation of trial. Note that all surrounding areas are unfertilized.